40,500 Wind Turbines on a Map: How I Built an Energy Data Platform in a Weekend
Last week I had a simple question: Where are all the wind turbines in Germany actually located?
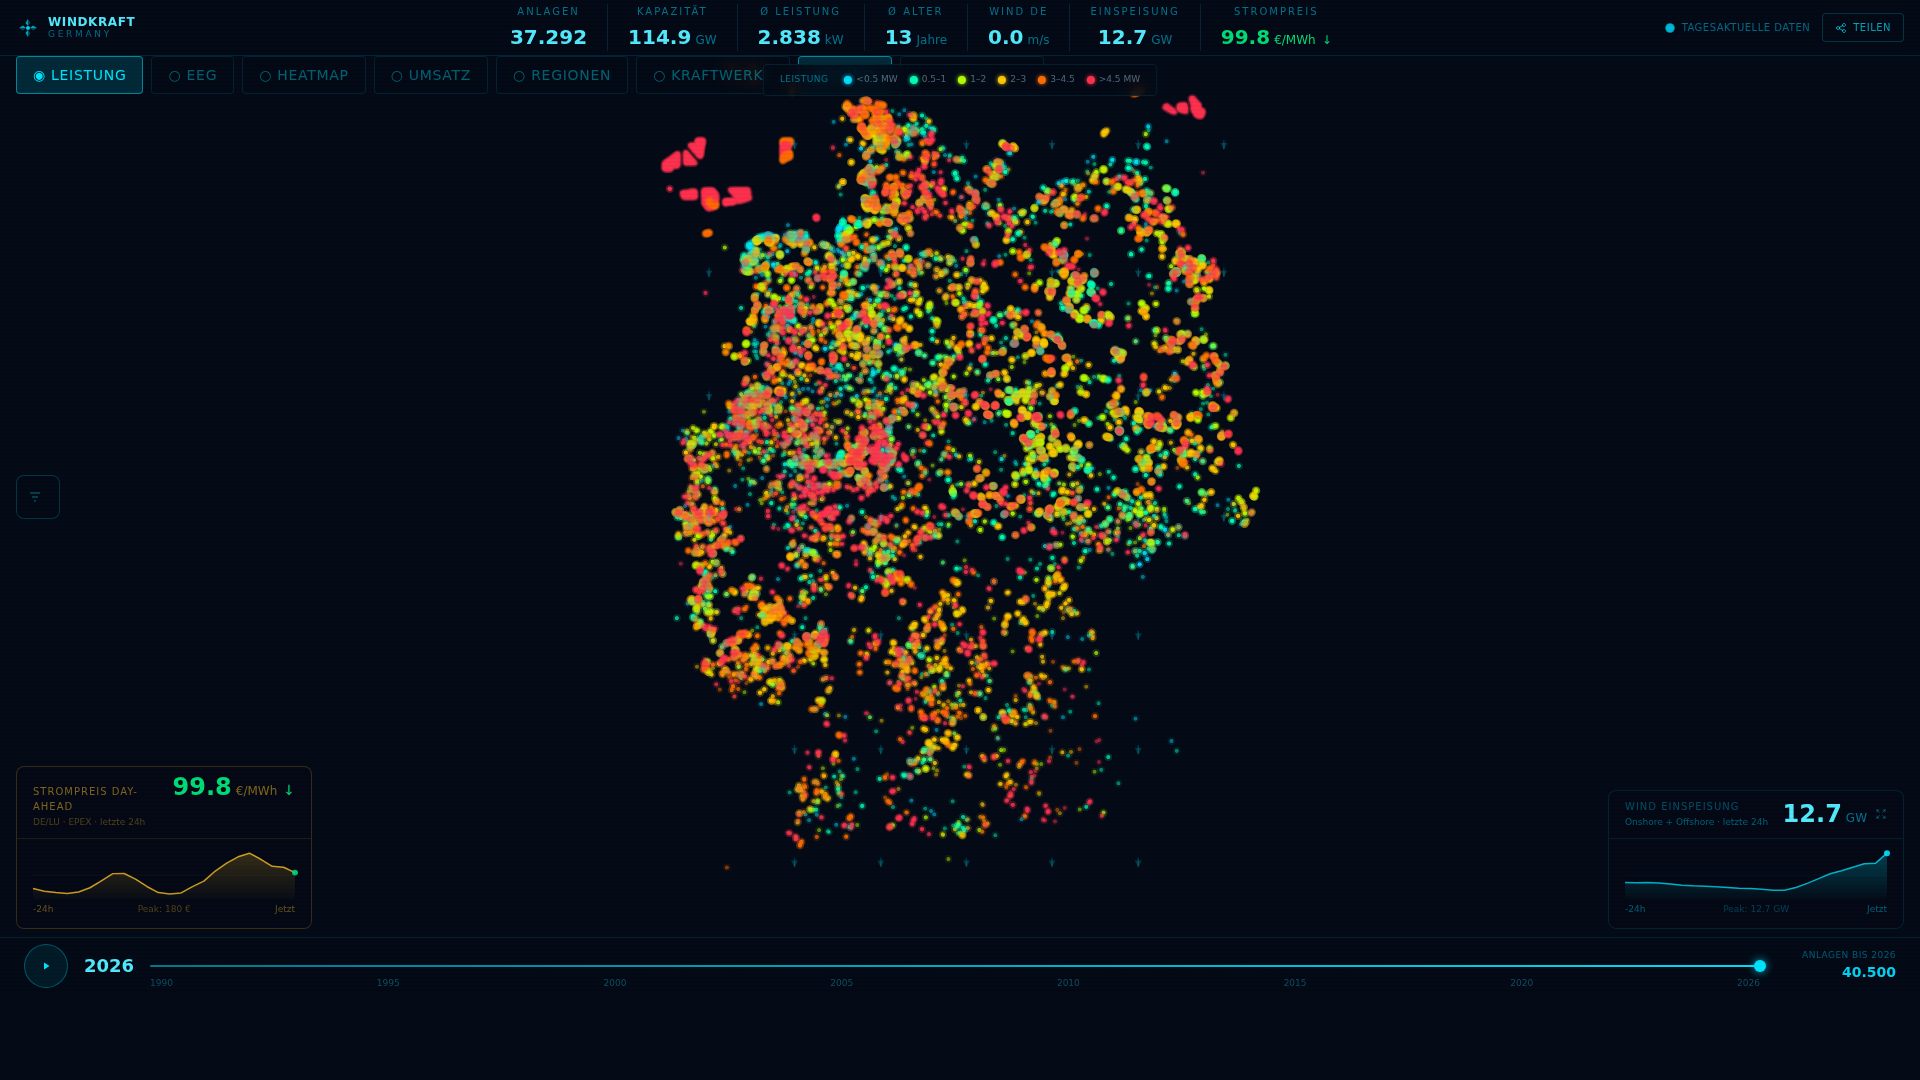
Not as a static chart in a PDF. Not as a table in a government database. As an interactive map that anyone can use — with real data, live.
48 hours later, the platform was online. 40,500 wind turbines. Each one with location, capacity, manufacturer, year of construction, and EEG subsidy expiration date.
What happened next surprised even me.
The Idea: Public Data Nobody Uses
Germany has one of the most comprehensive energy data registries in the world: the Marktstammdatenregister (MaStR), maintained by the Federal Network Agency. Every solar panel, every wind turbine, every power plant — all registered, all public, all under an open license.
The problem: The data sits in XML bulk exports or behind an API. To use it, you need programming skills, patience, and a few hours to parse it.
Or you let AI agents do the work.
The Tech Stack
The platform runs on a surprisingly simple stack:
- Next.js — The frontend framework
- deck.gl + MapLibre — For map visualization. deck.gl renders hundreds of thousands of data points smoothly, MapLibre provides the base map
- MaStR data — 40,500 wind turbines as JSON, extracted from the XML bulk export
- SMARD API — Live feed-in data and electricity prices from the Federal Network Agency
- Bright Sky API — Current wind speeds from the German Weather Service
The key point: All data sources are public and commercially usable. No proprietary APIs, no expensive licenses, no dependencies.
What the Data Reveals
When you put 40,500 wind turbines on a map, you see patterns that no statistics table can show:
🔴 9,247 Turbines Without Subsidies
Nearly a quarter of all wind turbines in Germany have already lost their EEG subsidy. The 20-year guaranteed feed-in tariff has expired. These turbines keep running — but at market prices that often don't cover costs.
For operators, each of these turbines is a decision point. Continue operation? Repowering? Decommission? The platform makes it visible at a glance where these decisions are imminent.
🟠 3,094 More by 2028
The next wave is coming: Over 3,000 turbines will lose their subsidies in the next two years. For the industry, this is both a massive challenge and an opportunity for new business models like Energy Sharing.
📍 The Concentration is Extreme
Schleswig-Holstein and Lower Saxony dominate. But the map also reveals the white spots — states with space and wind, but few turbines. Bavaria, for example, has fewer wind turbines than some individual districts in northern Germany.
Conventional Power Plants: The Contrast
🚀 Want to build your own AI agent?
In 90 minutes, learn exactly how I built my AI agent team that handles 50,000 tasks per week — using the same system I run every day.
🎟️ Get the Crash Course — €49One-time payment • Lifetime access • 14-day money-back guarantee
For context, I also added 396 conventional power plants to the map — natural gas, hard coal, lignite, oil. The visual contrast is striking: 40,500 decentralized wind turbines vs. 396 centralized large power plants. That is the energy transition in one image.
Features
- Color modes: By capacity, manufacturer, year built, EEG status, revenue — or as a heatmap
- Regional statistics: Choropleth map by state with hover tooltips
- Live data: Current wind feed-in and electricity prices
- Time slider: Scroll through expansion from 1990 to 2026
- Filters: By state, manufacturer, capacity, year
- Mobile-optimized: Bottom sheets, touch targets, responsive charts
The AI Agents Behind the Project
I didn't build this platform alone. My AI agent handled most of the implementation:
- Data pipeline: Parse MaStR XML export, enrich with postal codes, convert to JSON
- Frontend: Map visualization, responsive design, charts
- Deployment: Cloudflare Tunnel, server configuration, automatic sync scripts
- Legal: Imprint, privacy policy, license verification for all data sources
My job was: Ask the right questions, make decisions, review results. The implementation? That was AI.
That's why a single weekend was enough.
24 Hours After the LinkedIn Post
I shared the platform link on LinkedIn. Within 24 hours:
- 24,000 impressions
- 16,000 people reached
- 114 reactions, 39 comments
- 29 bookmarks
And then the first concrete business inquiry came in.
Someone from the energy industry wrote to me: In his home village, there's a metalworking company that consumes more electricity than the entire village combined. With the upcoming EU Energy Sharing regulations (from mid-2026), he wants to turn the village into the company's power plant.
His idea for the platform:
- Visualize a single balancing group
- Aggregate all renewable energy sources (wind + solar + biogas)
- Generate load curves from generation data
This would bring all stakeholders to the table: Show the company how much renewable energy is available. Show the grid operator how it relieves their network. Show residents that their investment in renewables benefits the local business.
That's the moment when a weekend project becomes a business.
Three Takeaways
1. Public data is an underrated resource. Germany has fantastic open data sources. The problem was never access — it was preparation. AI solves exactly this problem.
2. Build in public works. I didn't present a finished product and hope someone buys. I shared an experiment and asked: Is this useful? The answer came as a concrete business inquiry.
3. AI agents change the equation. A year ago, this project would have taken weeks and a small team. Now it's a weekend and an AI agent. Costs are minimal, speed is absurd.
Try It Yourself
The platform is live and free to use:
Zoom in, click on a turbine, explore the data. And if you have an idea for what else could be built with this — reach out on LinkedIn.
The data is public. The technology is here. The only question is: What will you build with it?
🚀 Want to build your own AI agent?
In 90 minutes, learn exactly how I built my AI agent team that handles 50,000 tasks per week — using the same system I run every day.
🎟️ Get the Crash Course — €49One-time payment • Lifetime access • 14-day money-back guarantee
Tags
About the Author

Jan Koch
KI Experte, Berater und Entwickler. Ich helfe Unternehmern und Entwicklern, KI effektiv einzusetzen - von der Strategie bis zur Implementierung.
Related Articles
37 GB Wasted: Why Automated Scripts Must Always Clean Up After Themselves
This morning my server disk was 100% full. The cause: an automated script had left 36 GB of temporary data lying around. One line of code would have prevented it.
3 min
I'm Building a Fully AI-Powered Company. Here's the Plan.
16 AI agents. 50,000 automated tasks per week. And I'm documenting the entire journey — every win, every failure, every lesson.
5 min
I Built a Fully AI-Driven Company. Here Is the Plan.
16 AI agents. 50,000 automated tasks per week. And I am documenting the entire journey — every success, every failure, every lesson.
5 min